
Mastering Crypto Charts: A Guide to Candlesticks, Trends, and IndicatorsIntroduction to Crypto Charts
If you’re diving into cryptocurrency trading, one of the most essential skills you’ll need to develop is the ability to read crypto charts. Understanding how to analyze price movements, identify trends, and spot key indicators can make the difference between successful trading and missed opportunities.
A good starting point for any trader is to look at crypto charts and learn how to interpret the data they display. These charts offer a visual representation of market activity and are crucial for technical analysis. For those new to the process, a crypto tutorial on chart analysis can be incredibly helpful.


In this article, we will break down the basics of reading crypto charts, focusing on candlesticks, trends, and indicators. To dive deeper into the world of crypto charting, check out this crypto tutorial on How to Read Crypto Charts: Candlesticks, Trends, and Indicators.
What Are Crypto Candlestick Charts?
One of the most commonly used chart types for analyzing cryptocurrency markets is the candlestick chart. This type of chart is useful for tracking price movements over specific periods of time, showing you at a glance how the price of a cryptocurrency has fluctuated during that period.
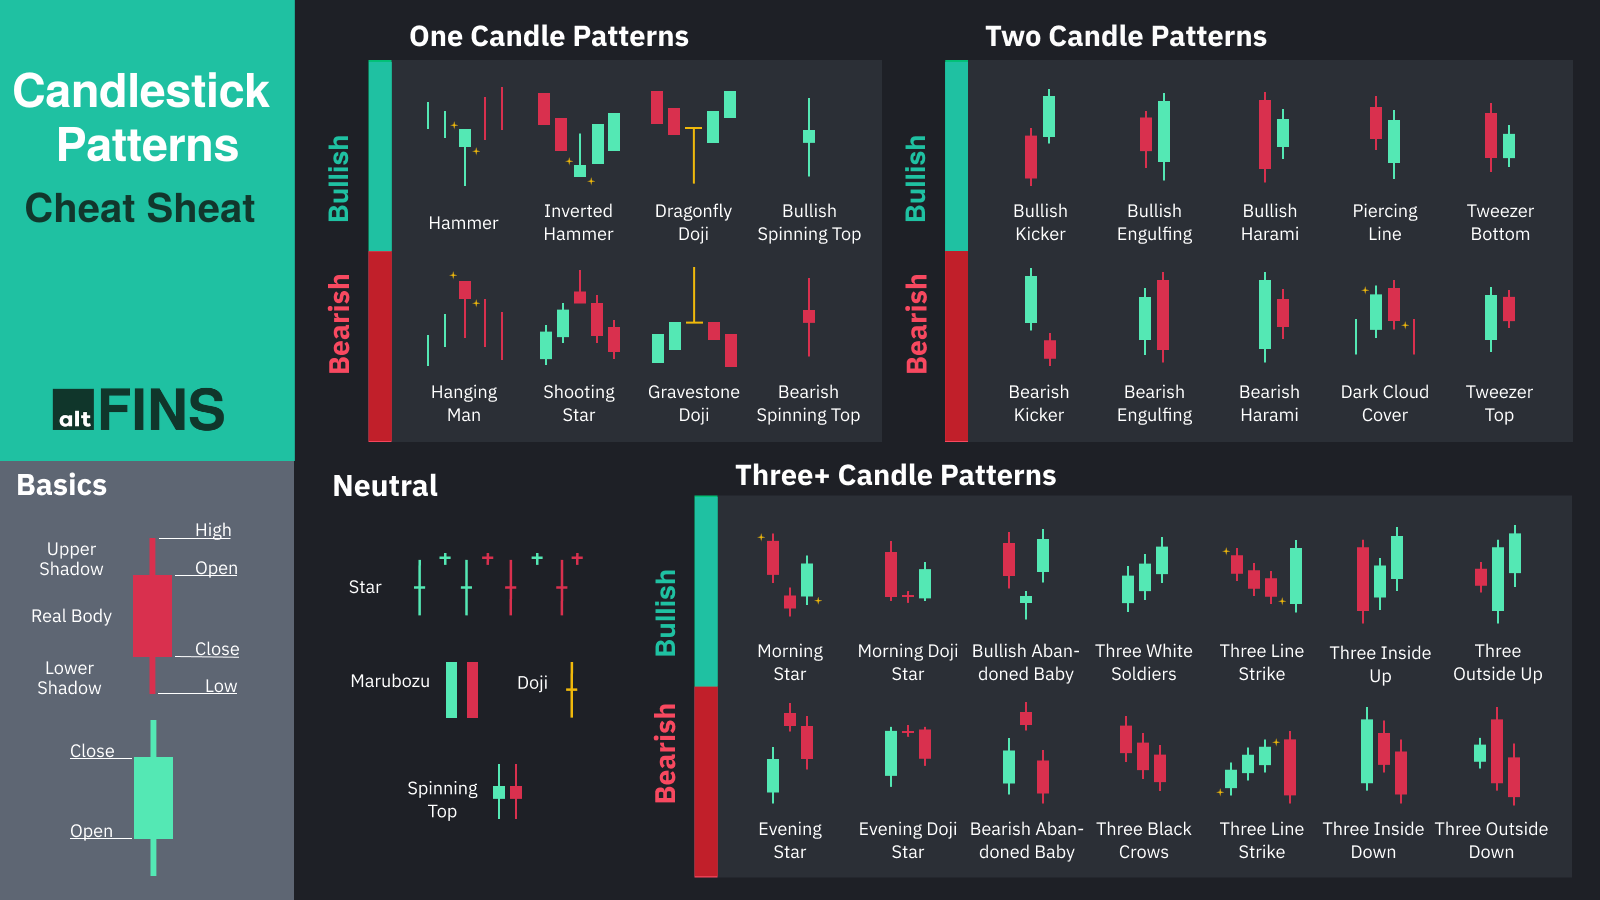
Structure of a Candlestick
A single candlestick contains four important pieces of information:
- Open Price: The price at which the asset opened at the beginning of the time period.
- Close Price: The price at which the asset closed at the end of the time period.
- High Price: The highest price reached during the time period.
- Low Price: The lowest price reached during the time period.
Candlesticks can be either bullish (indicating that the price has gone up during the period) or bearish (indicating that the price has gone down during the period).
- Bullish Candlesticks: These are typically green or white and show that the closing price is higher than the opening price.
- Bearish Candlesticks: These are typically red or black and show that the closing price is lower than the opening price.
Understanding candlestick patterns is crucial in recognizing market sentiment, predicting future price movements, and crafting trading strategies.
Identifying Crypto Trends
When analyzing crypto charts, one of the most important things to understand is market trends. A trend is the general direction in which the price of an asset is moving, and it can be classified into three categories:
- Uptrend: When the price is consistently rising.
- Downtrend: When the price is consistently falling.
- Sideways/Range-bound trend: When the price fluctuates within a certain range with no clear upward or downward movement.
Recognizing trends early on can help traders make more informed decisions about when to buy and sell. In crypto markets, trends can sometimes change abruptly, so keeping an eye on price action and key chart patterns is important.
Key Crypto Indicators for Technical Analysis
In addition to candlesticks and trends, crypto indicators play a vital role in understanding market conditions. These tools help traders analyze past market data to make predictions about future price movements.
Popular Crypto Indicators:
- Moving Averages (MA): These indicators show the average price of an asset over a specific time frame, smoothing out price data to make trends clearer. The two most commonly used moving averages are the Simple Moving Average (SMA) and the Exponential Moving Average (EMA).
- Relative Strength Index (RSI): The RSI is a momentum oscillator that measures the speed and change of price movements. It helps traders identify whether an asset is overbought or oversold, which can signal potential reversals in price.
- MACD (Moving Average Convergence Divergence): The MACD is a trend-following momentum indicator that shows the relationship between two moving averages of an asset’s price. It helps traders identify buy and sell signals by analyzing the crossover of the MACD line and the signal line.
- Volume: Volume represents the number of assets traded during a particular period. It helps traders assess the strength of a price movement. High trading volume during a price increase suggests strong buyer interest, while low volume may indicate weak support for a price move.
Combining Candlesticks, Trends, and Indicators
When analyzing crypto charts, it’s important to combine different elements of charting to gain a clearer picture of market conditions. For example, you might observe a bullish candlestick pattern in an uptrend and confirm the signal with a high RSI value, suggesting that the market is overbought.
By combining candlesticks, trends, and technical indicators, traders can make more accurate predictions about price movements and identify potential entry and exit points.
Why a Crypto Tutorial is Essential for Beginners
For newcomers to cryptocurrency trading, a crypto tutorial can be a valuable resource. It helps you understand the basics of chart analysis, provides a foundation for technical analysis, and equips you with the skills needed to interpret market signals.
Learning how to read crypto charts, understand candlestick patterns, recognize trends, and use technical indicators will help you make more informed decisions, reduce risk, and improve your trading strategies.
If you want to start learning how to read crypto charts in greater detail, check out this comprehensive crypto tutorialon how to read crypto charts.


